The main elements of the relief, at different distances from pollution sources, on the border of SPZ to assess the pollution and on the border of the residential area were selected soil samples. The results of analyzes on the contents of trace elements in soil, are shown in Tables 1 and 2. Analysis of the influence zone OGM «Zhayikoil» on the soil of residential settlements are shown in Tables 3 and 4 [1–5].
Observation of the state of water in the region is carried out in 2 directions: since1991–observation of surface water, and since 1994 in addition – observation of groundwater [1–5].
Sampling point located approximately 10 km from the coastline. Because of the low slope of the Caspian Sea in the sampling points of the depth does not exceed 1 m. This defines the pollution effects on flora and fauna in the coastal area. If during the summer due to the wind and the movement of water pollution in the coastal areas oilfield naturally neutralized, in the autumn-winter period to living organisms creates unfavorable conditions.
Table 1
The chemical analysis of the soil. Macrocomponents
|
Number of laboratory |
Number of sample order |
The location of the sampling |
Macrocomponents, mg/kg of soil |
||||
|
рН |
CO3 |
HCO3 |
SO4 |
Cl |
|||
|
165 |
1 |
SPZ OGM (north) |
6,5 |
not found |
936,0 |
154,0 |
10,9 |
|
166 |
2 |
SPZ OGM (south) |
6,4 |
not found |
696,0 |
256,0 |
10,2 |
|
167 |
3 |
SPZ OGM (west) |
6,2 |
not found |
366,0 |
20,0 |
11,8 |
|
168 |
4 |
SPZ OGM (east) |
6,3 |
not found |
329,0 |
14,0 |
12,0 |
|
169 |
5 |
Nuclear test site (north) |
6,8 |
not found |
489,0 |
1951,0 |
14,9 |
|
170 |
6 |
Nuclear test site (south) |
6,5 |
not found |
712,0 |
2934,0 |
15,8 |
|
171 |
7 |
Nuclear test site (west) |
6,4 |
not found |
670,0 |
15,0 |
10,0 |
|
172 |
8 |
Nuclear test site (east) |
6,9 |
not found |
1653,0 |
9,8 |
14,8 |
|
173 |
9 |
Balgimbaev village |
6,6 |
not found |
305,0 |
10,0 |
15,2 |
Table 2
The chemical analysis of the soil. Heavy metals and petroleum products
|
Number of laboratory |
Number of sample order |
The location of the sampling |
Various components, mg/kg of soil |
||||||||
|
Cr |
Ni |
Zn |
Cu |
Pb |
Cd |
Fe overall |
Мn |
oil products |
|||
|
1 |
2 |
3 |
4 |
5 |
6 |
7 |
8 |
9 |
10 |
11 |
12 |
|
165 |
1 |
SPZ OGM (north) |
0,7 |
3,6 |
less than 0,1 |
2,4 |
0,010 |
found |
9,3 |
30,0 |
16,8 |
|
166 |
2 |
SPZ OGM (south) |
0,4 |
3,4 |
less than 0,1 |
2,6 |
0,010 |
not found |
1,0 |
10,0 |
not found |
|
167 |
3 |
SPZ OGM (west) |
0,3 |
3,4 |
less than 0,1 |
0,9 |
footprints |
not found |
2,0 |
14,9 |
18,5 |
|
168 |
4 |
SPZ OGM (east) |
0,3 |
2,7 |
less than 0,1 |
1,2 |
0,004 |
0,003 |
8,0 |
18,0 |
19,3 |
|
169 |
5 |
Nuclear test site (north) |
3 |
3,4 |
less than 0,1 |
2,0 |
footprints |
0,001 |
0,3 |
10,9 |
39,2 |
|
170 |
6 |
Nuclear test site (south) |
3,2 |
3,7 |
less than 0,1 |
2,9 |
0,003 |
not found |
0,6 |
10,0 |
not found |
|
1 |
2 |
3 |
4 |
5 |
6 |
7 |
8 |
9 |
10 |
11 |
12 |
|
171 |
7 |
Nuclear test site (west) |
2 |
2,8 |
less than 0,1 |
2,0 |
0,004 |
0,005 |
3,5 |
38,0 |
12,4 |
|
172 |
8 |
Nuclear test site (east) |
1,2 |
3,8 |
less than 0,1 |
1,3 |
0,001 |
found |
1,2 |
58,1 |
not found |
|
173 |
9 |
Balgimbaev village |
less than 0,1 |
2,4 |
less than 0,1 |
1,9 |
0,004 |
0,003 |
8,9 |
12,0 |
not found |
|
MPC, mg/kg |
6 |
4 |
23 |
3 |
32 |
1 |
1000 |
||||
Table 3
Results of chemical analysis of soils inhabited villages. Macrocomponents
|
Number of laboratory |
Number of sample order |
The location of the sampling |
Macrocomponents., mg/kg of soil |
||||
|
HCO3 |
CO3 |
Cl |
SO4 |
рН |
|||
|
158 |
Т-1 |
village |
305,0 |
not found |
14,8 |
20,0 |
5,7 |
|
159 |
Т-2 |
village |
366,0 |
not found |
12,3 |
20,0 |
7,2 |
|
160 |
Т-3 |
outside the village |
427,0 |
not found |
10,6 |
30,0 |
6,5 |
Table 4
Results of chemical analysis of soils inhabited villages. Various components
|
Number of laboratory |
Number of sample order |
Various components, mg/kg of soil |
||||||||
|
Cr |
Ni |
Zn |
Cu |
Pb |
Cd |
Fe общ. |
Mn |
н/п |
||
|
158 |
Т-1 |
not found |
1,2 |
not found |
3,0 |
0,01 |
not found |
6,5 |
91,1 |
175,1 |
|
159 |
Т-2 |
not found |
0,9 |
not found |
1,6 |
н/о |
not found |
6,8 |
19,1 |
not found |
|
160 |
Т-3 |
not found |
0,3 |
not found |
2,1 |
0,03 |
not found |
2,1 |
90,0 |
not found |
Table 5
The chemical analysis of the water. Macrocomponents
|
Point |
The location of the sampling |
pH |
Concentration of chemical substances, mg/lit |
||||
|
|
|
|
|
|
|||
|
I quarter of 2003 |
|||||||
|
1 |
Drinking water wells |
7,2 |
591,7 |
not found |
0,05 |
3,5 |
290,6 |
|
2 |
The river at the entrance of the SPZ |
7,0 |
335,5 |
not found |
0,15 |
0,5 |
286,0 |
|
3 |
River at the outlet of the SPZ |
7,3 |
384,3 |
not found |
0,15 |
0,7 |
240,0 |
|
4 |
Water intake № 1 |
7,1 |
128,1 |
not found |
0,07 |
0,6 |
20,0 |
|
5 |
Water intake № 2 |
7,4 |
134,2 |
not found |
0,01 |
0,5 |
26,2 |
|
II quarter of 2003 |
|||||||
|
1 |
Drinking water wells |
6,9 |
353,8 |
not found |
0,01 |
8,6 |
390,0 |
|
2 |
The river at the entrance of the SPZ |
6,8 |
164,2 |
not found |
0,01 |
0,2 |
184,0 |
|
3 |
River at the outlet of the SPZ |
6,9 |
195,2 |
not found |
0,01 |
0,2 |
204,0 |
|
4 |
Water intake № 1 |
6,7 |
51,5 |
not found |
н/о |
0,0 |
17,0 |
|
5 |
Water intake № 2 |
6,4 |
79,9 |
not found |
0,02 |
0,2 |
22,0 |
|
III quarter of 2003 |
|||||||
|
1 |
Drinking water wells |
6,8 |
360,0 |
not found |
0,01 |
2,2 |
398,0 |
|
2 |
The river at the entrance of the SPZ |
6,9 |
227,0 |
not found |
0,03 |
0,2 |
230,0 |
|
3 |
River at the outlet of the SPZ |
6,9 |
265,4 |
not found |
0,01 |
0,2 |
270,0 |
|
4 |
Water intake № 1 |
6,6 |
88,1 |
not found |
0,01 |
0,3 |
н/о |
|
5 |
Water intake № 2 |
6,5 |
82,3 |
not found |
0,005 |
0,3 |
21,5 |
|
IV quarter of 2003 |
|||||||
|
1 |
Drinking water wells |
7,5 |
384,3 |
not found |
0,008 |
2,1 |
430,0 |
|
2 |
The river at the entrance of the SPZ |
8,3 |
237,9 |
not found |
0,023 |
0,2 |
230,0 |
|
3 |
River at the outlet of the SPZ |
8,0 |
274,6 |
not found |
0,009 |
0,2 |
270,0 |
|
4 |
Water intake № 1 |
7,3 |
97,6 |
not found |
0,010 |
0,4 |
н/о |
|
5 |
Water intake № 2 |
7,0 |
97,6 |
not found |
0,004 |
0,3 |
20,0 |
|
MPC (fishery water), mg/lit |
– |
– |
– |
0,08 |
40,0 |
100,0 |
|
|
MPC (drinking water), mg/lit |
– |
– |
– |
3,3 |
45,0 |
500 |
|

Fig. 1. The concentration of chemicals in drinking water wells

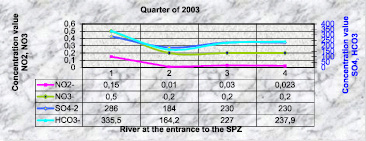
Fig. 2. The concentration of chemicals in the river at the entrance of the SPZ

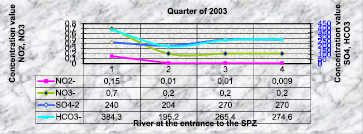
Fig. 3. The concentration of chemicals in the river at the output of the SPZ

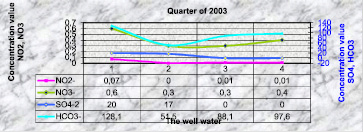
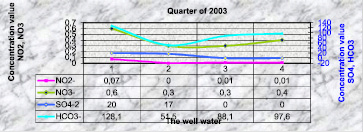
Fig. 4. The concentration of chemicals in water wells

Fig. 5. The concentration of chemicals from the water intake № 2
Within 120 days on the surface of the water keeps the ice. At this time, the accumulation of dirt on the surface of the ice and under it due to seepage of oil from flooded wells. Therefore, in the spring creates an increased concentration of hydrocarbons in water, due to reach the surface of water accumulated over the winter, and with the influx of meltwater from the coastal area adjacent to the mine.
Table 6
Results of chemical analyzes of water. Heavy metals and petroleum products
|
Point Number |
The location of the sampling |
Concentration of chemical substances, mg/lit |
||||||
|
Cr |
Ni |
Zn |
Cu |
Pb |
Cd |
Petroleum products |
||
|
1 |
2 |
3 |
4 |
5 |
6 |
7 |
8 |
9 |
|
I quarter of 2003 |
||||||||
|
1 |
Drinking water wells |
0,02 |
0,005 |
0,05 |
< 0,003 |
0,003 |
0,001 |
not found |
|
2 |
The river at the entrance of the SPZ |
0,02 |
0,002 |
0,07 |
0,02 |
not found |
not found |
not found |
|
3 |
River at the outlet of the SPZ |
0,06 |
< 0,001 |
0,05 |
0,02 |
not found |
not found |
not found |
|
4 |
Water intake № 1 |
0,02 |
0,013 |
0,06 |
< 0,003 |
н/о |
н/о |
not found |
|
5 |
Water intake № 2 |
0,03 |
0,002 |
0,07 |
0,02 |
0,005 |
0,002 |
not found |
|
II quarter of 2003 |
||||||||
|
1 |
Drinking water wells |
0,02 |
not found |
0,02 |
not found |
0,003 |
0,001 |
not found |
|
2 |
Temir river (at the entrance of the SPZ) |
0,02 |
not found |
0,02 |
0,005 |
not found |
not found |
not found |
|
3 |
Temir river (at the outlet of the SPZ) |
0,02 |
not found |
0,02 |
0,005 |
not found |
not found |
not found |
|
4 |
Water intake № 1 |
0,02 |
not found |
0,02 |
0,003 |
not found |
not found |
not found |
|
5 |
Water intake № 2 |
0,03 |
not found |
0,03 |
0,003 |
0,005 |
0,002 |
not found |
|
III quarter of 2003 |
||||||||
|
1 |
Drinking water wells |
0,02 |
not found |
0,02 |
3,0 |
0,002 |
0,001 |
< 0,005 |
|
2 |
Temir river (at the entrance of the SPZ) |
0,02 |
not found |
0,03 |
0,08 |
not found |
not found |
< 0,005 |
|
3 |
Temir river (at the outlet of the SPZ) |
0,03 |
not found |
0,04 |
0,17 |
not found |
not found |
< 0,005 |
|
4 |
Water intake № 1 |
0,02 |
not found |
0,02 |
not found |
not found |
not found |
< 0,005 |
|
5 |
Water intake № 2 |
0,02 |
not found |
0,02 |
0,02 |
0,003 |
0,001 |
< 0,005 |
|
IV quarter of 2003 |
||||||||
|
1 |
Drinking water wells (Sorkol village) |
not found |
not found |
0,02 |
3,45 |
0,002 |
0,001 |
< 0,006 |
|
1 |
2 |
3 |
4 |
5 |
6 |
7 |
8 |
9 |
|
2 |
Temir river (at the entrance of the SPZ) |
0,02 |
not found |
0,02 |
0,09 |
not found |
not found |
< 0,006 |
|
3 |
Temir river (at the outlet of the SPZ) |
not found |
not found |
0,03 |
019 |
not found |
not found |
< 0,006 |
|
4 |
Water intake № 1 |
0,01 |
not found |
0,01 |
0,05 |
not found |
not found |
< 0,006 |
|
5 |
Water intake № 2 |
0,01 |
not found |
0,03 |
not found |
0,004 |
0,001 |
< 0,006 |
|
MPC (fishery water), mg/lit |
0,001 |
0,01 |
0,01 |
0,001 |
– |
0,001 |
0,05 |
|
|
MPC (drinking water), mg/lit |
0,05 |
0,1 |
1,0 |
1,0 |
0,03 |
– |
0,3 |
|
The results of data analysis studies of soil, surface water and groundwater have shown that the presence of heavy metals, macro components, petroleum products requires a special attention, supervision and control over these environments.
The work is submitted to the International Scientific Conference «The man and the noosphere. Scientific heritage of V.I. Vernadsky. Global problems of modern civilization», UAE (Dubai), October 16–23, 2015, came to the editorial office оn 03.09.2015.


